Klara Karbon
Carbon accounting that shows its work
Klara helps small Norwegian businesses calculate emissions from their accounting data. It imports invoice lines, matches them to emission factors with OCR and GPT, and shows how each result was calculated so users can review and correct it.

My Design Role
I was the sole designer on a small team. I interviewed sustainability experts and potential customers, then turned the findings into wireframes, prototypes, and the product’s design system. After the MVP launched, I revised the workflow using feedback from beta customers. I also designed the Klara name, logo, and colour palette.

Discover and Research
To create a carbon accounting platform, we needed to gain domain knowledge. I conducted interviews with sustainability experts in Norway and took an online course on sustainability with my team. We also analysed existing carbon accounting solutions on the market.
Key Findings and Challenges
Our research revealed two main issues:
- Calculations were hard to inspect. Users could see an emissions total but not always how the system reached it.
- The tools assumed expert knowledge. Small businesses needed to understand the calculation well enough to check it without hiring a sustainability specialist.
Design process
Simplifying the Workflow
Users import invoices from their accounting software. OCR and GPT then map each invoice line to an emission factor. The navigation follows the three parts of that job:
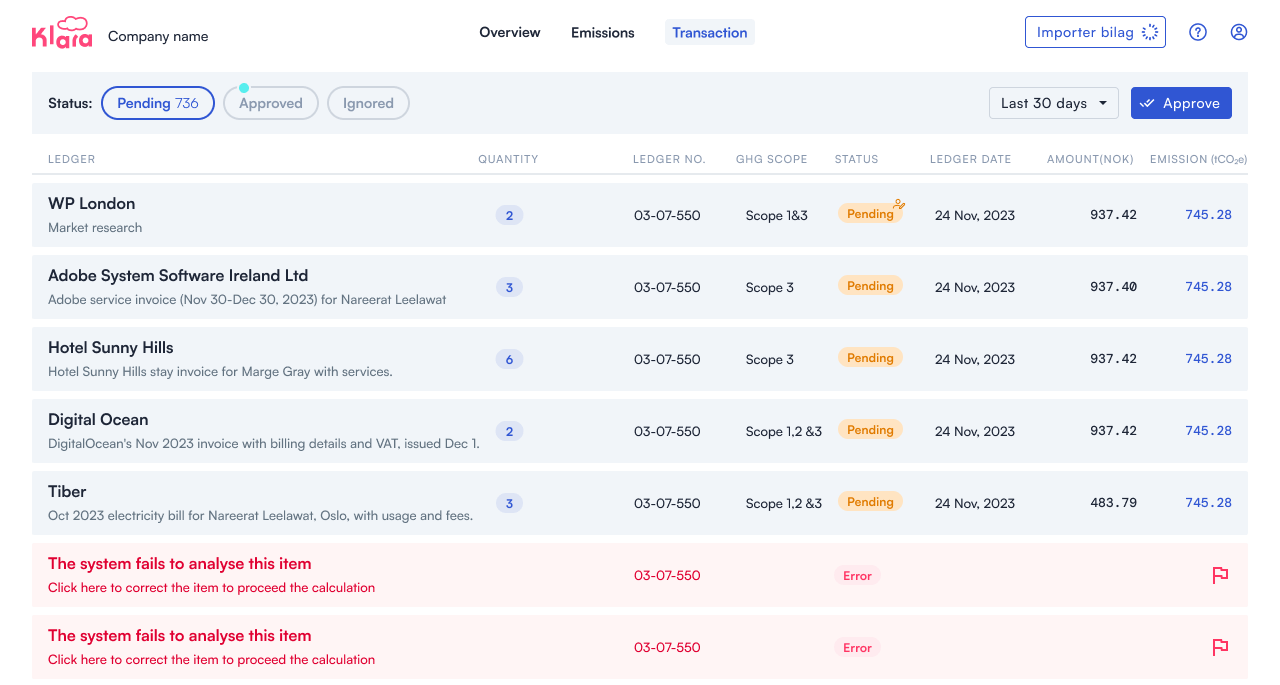
- Transaction page: Users can view and edit imported invoices, along with calculated emissions and categories.
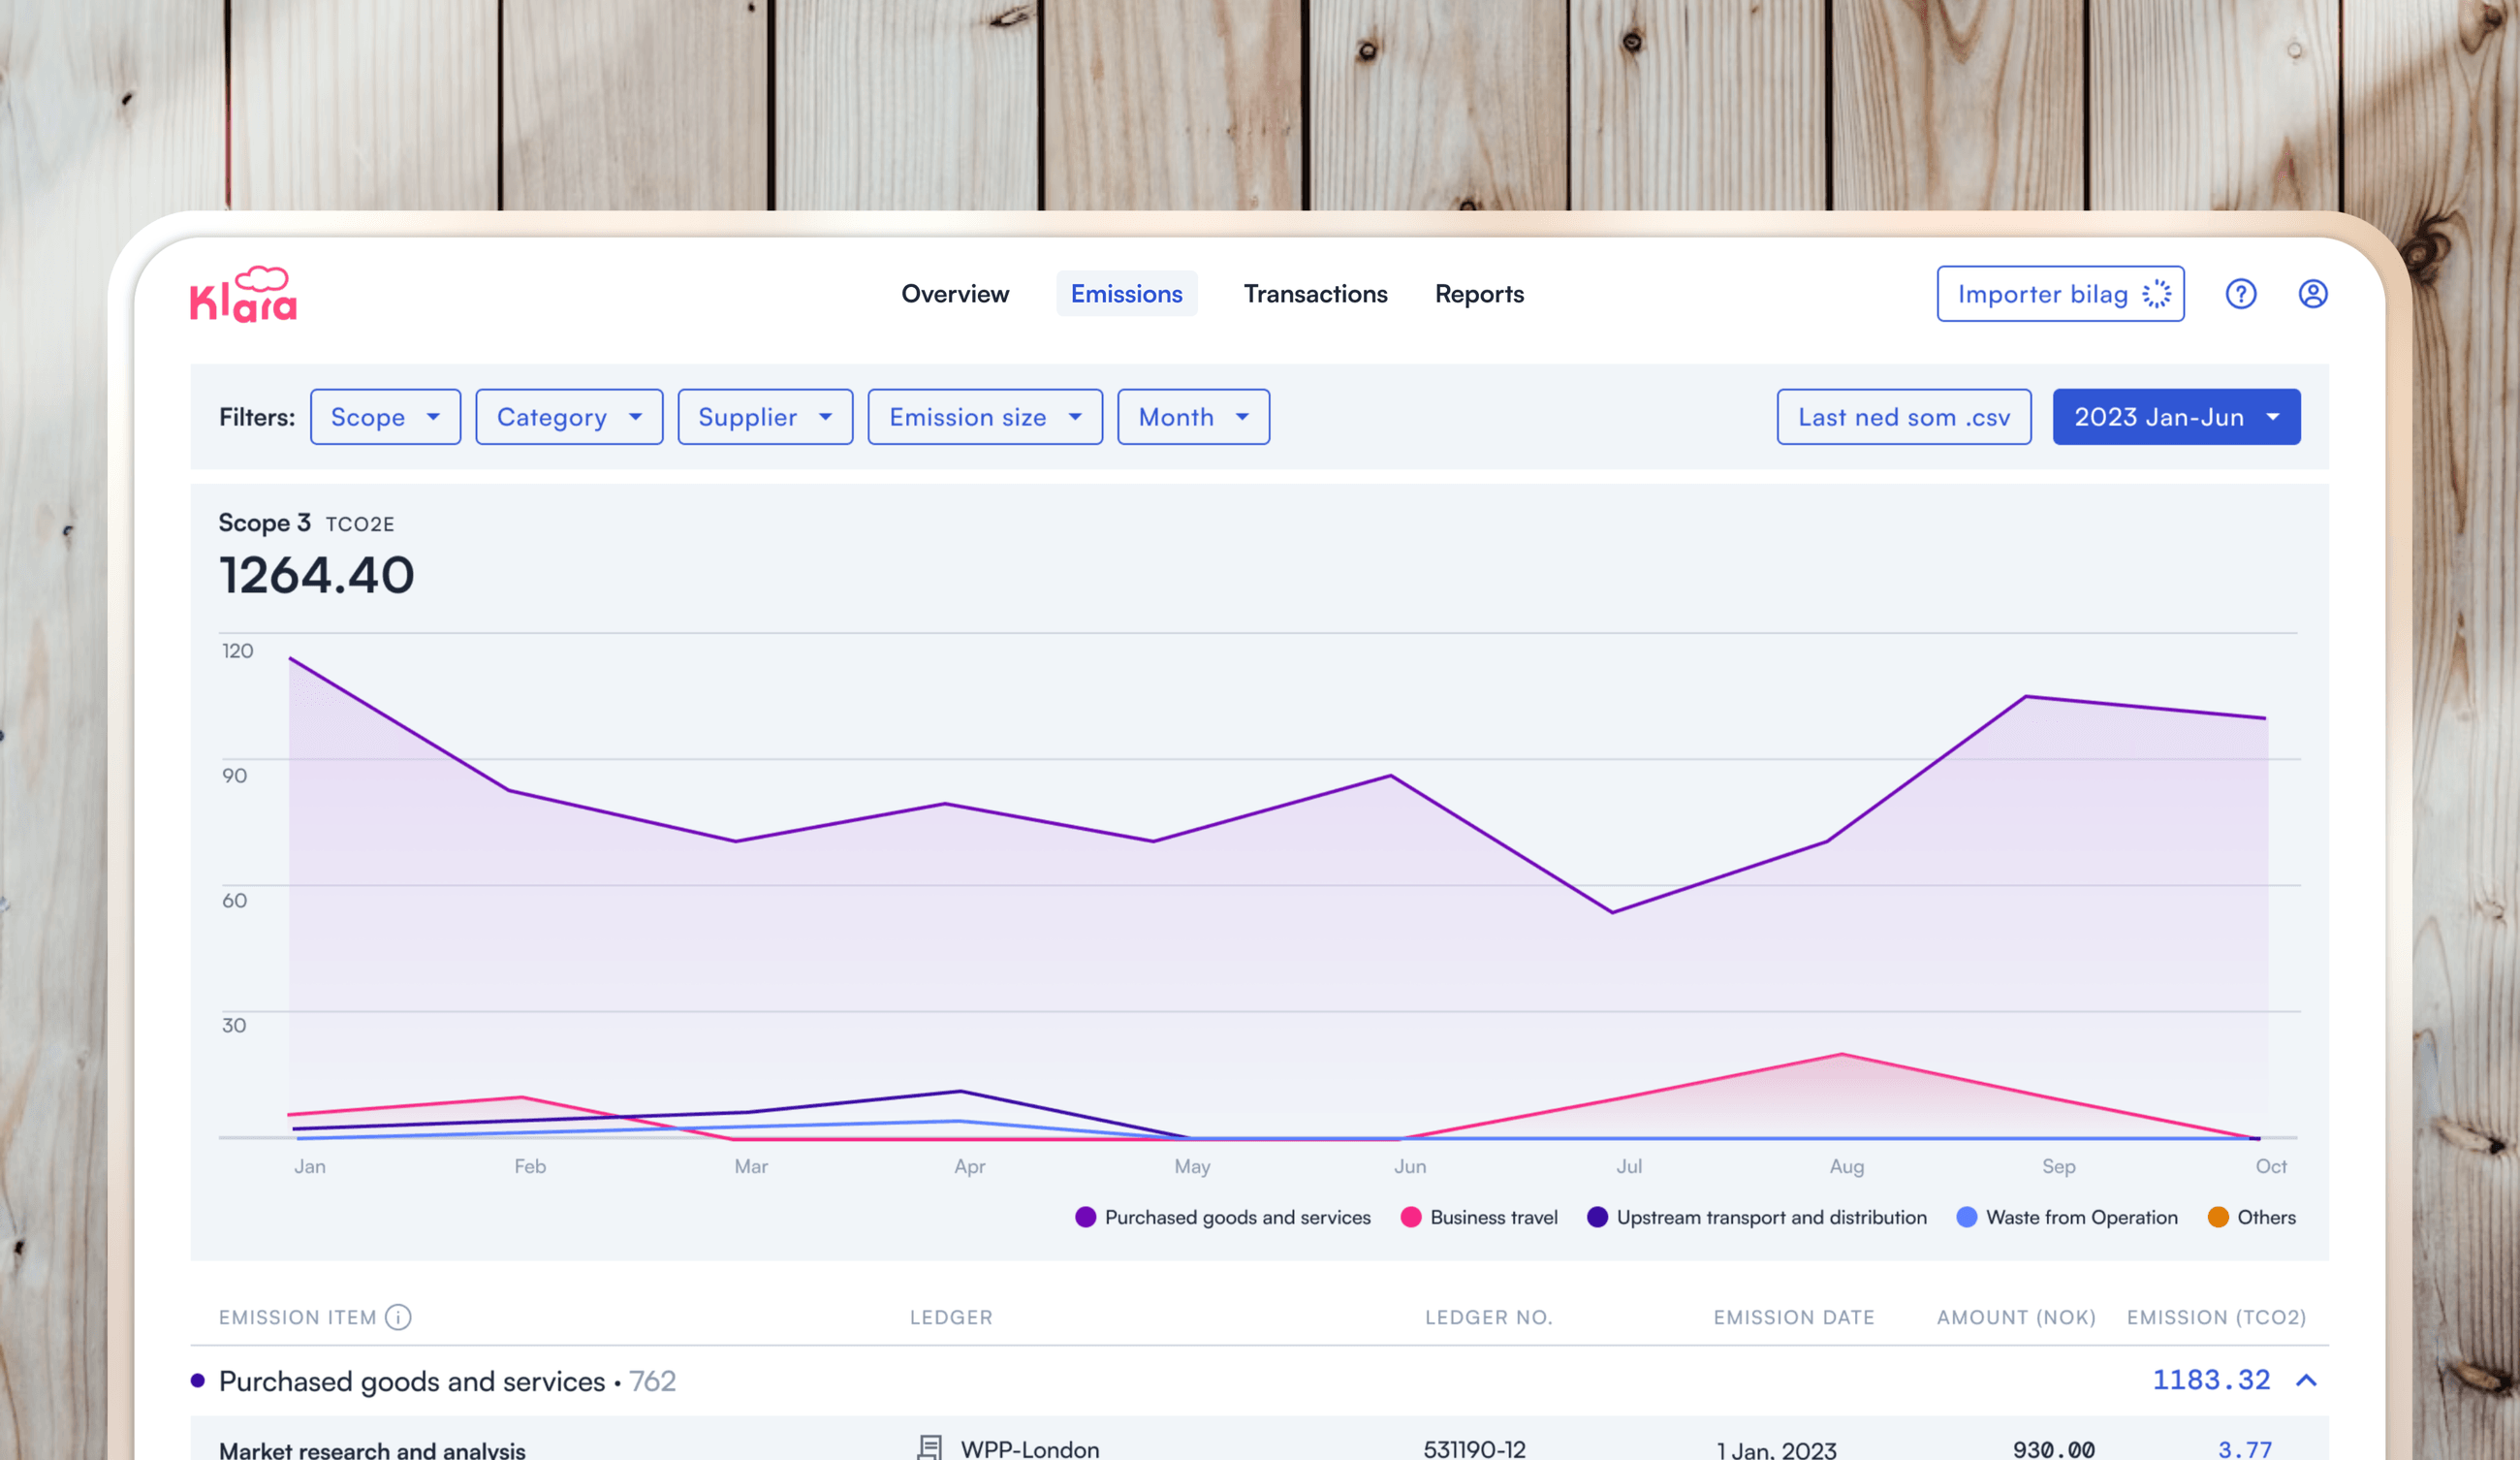
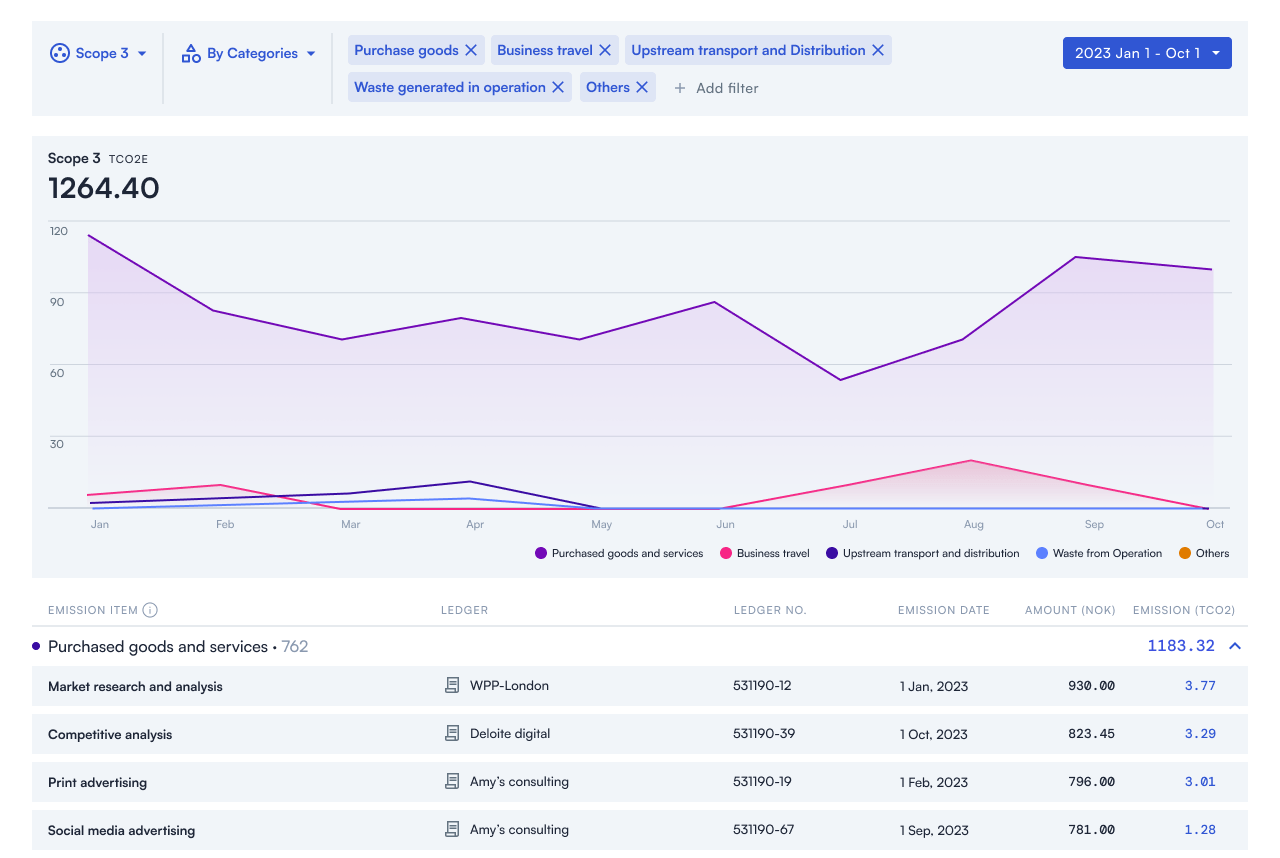
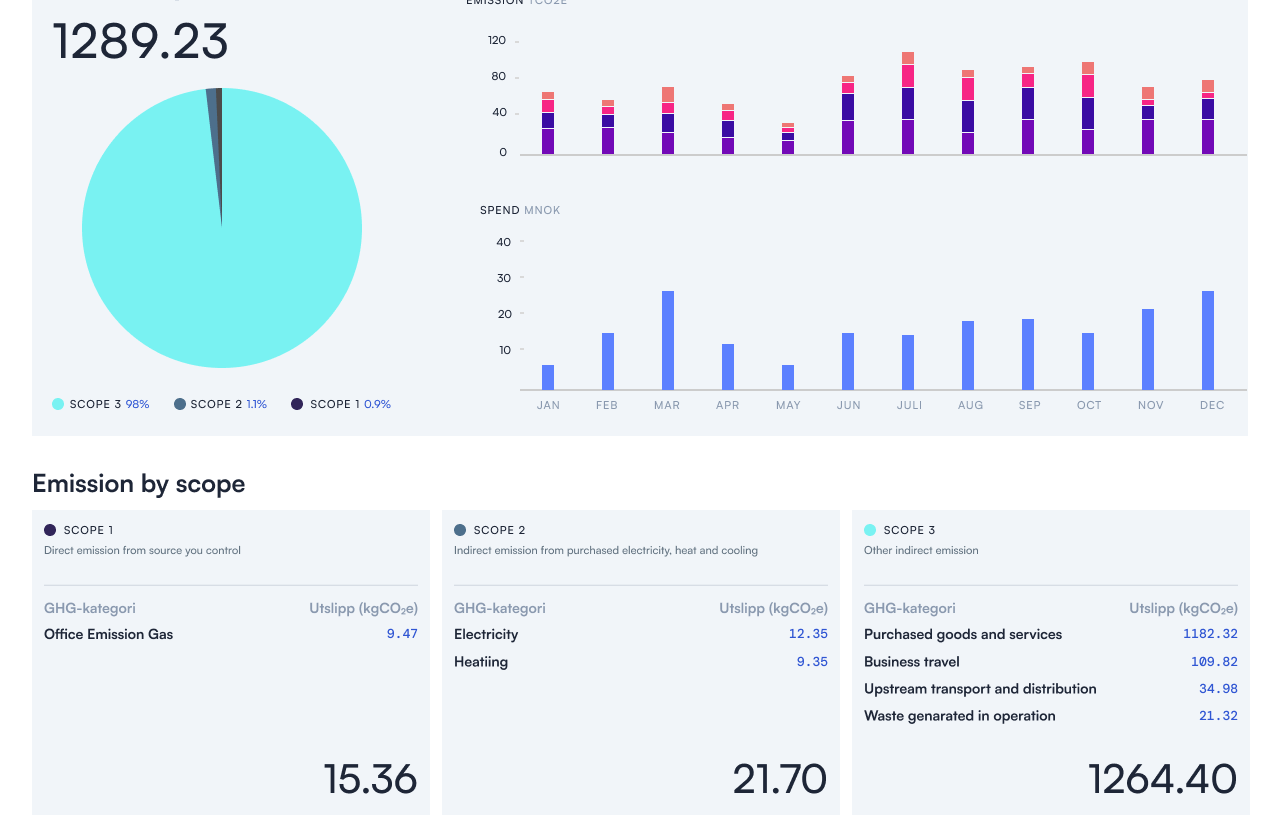
- Emissions page: This page displays emission values by category, providing users with data to inform their decisions on reducing emissions.
- Overview: A dashboard-style page showing the total emissions for all categories.
User Testing and Iteration
We tested a high-fidelity prototype without giving participants a tutorial. When first-time users missed important steps, we added guidance at those points in the workflow.
Prioritising accuracy and transparency
In addition to transparency, accuracy was a top priority. Unlike other products that use the less precise “spend-based” method, we employed an “activity-based” approach, calculating emission values based on the unit of activity rather than the amount spent.
The interface shows the inputs behind each calculation and lets users edit them. The two screens below show how the Transaction Detail page changed after the MVP:
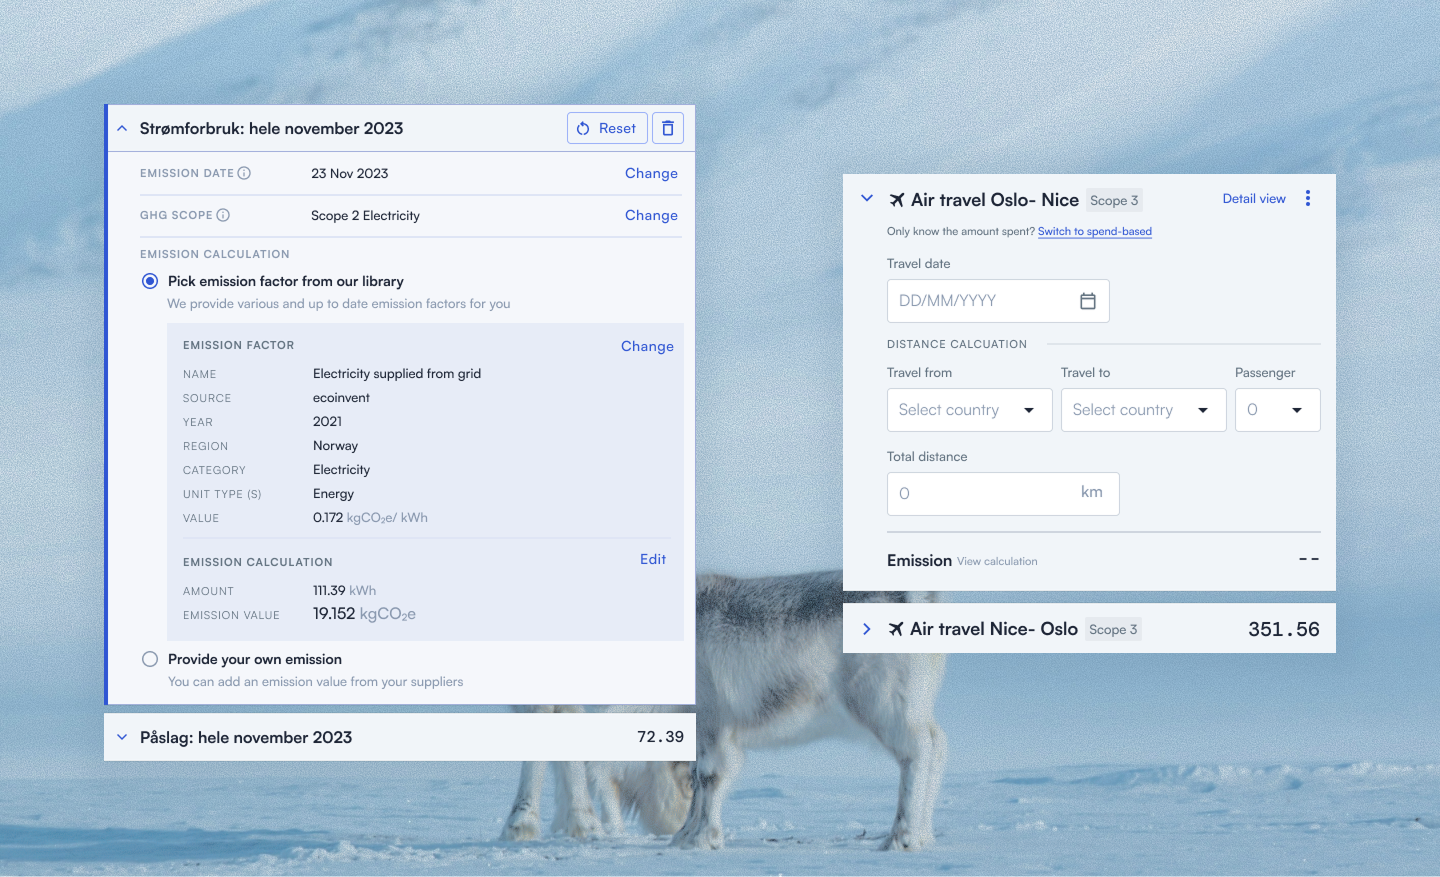
Before MVP Our initial design assumed expert users who would understand the calculation and emission factors. The interface focused on displaying results and emission factors from trusted sources.
After MVP We redesigned the UI for regular users with limited knowledge of carbon emissions. The new design helps users understand the calculation process and is less focused on the source of emission factors.
Launch and outcome
Klara launched its MVP in April 2024. Feedback from beta customers changed our assumption about the audience: the product had to work for regular business users, not only sustainability experts. We redesigned the interface around that audience, refined the approval flow, and added integrations with more accounting systems.